std_circle
-
ArithmeticMeanCurve.std_circle¶ Represents the standard deviation as a circle.
- Returns
StdCircle
Examples
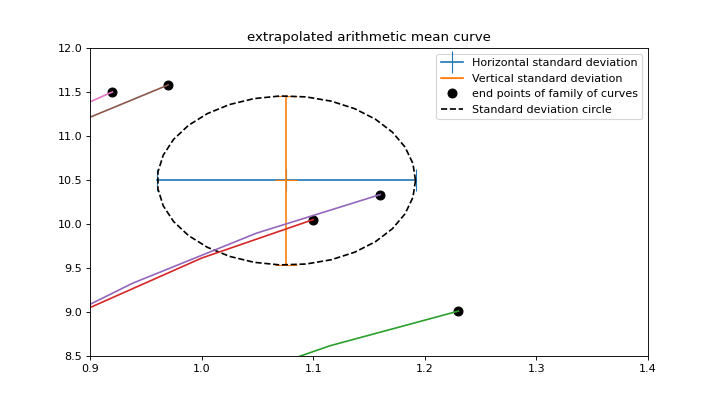
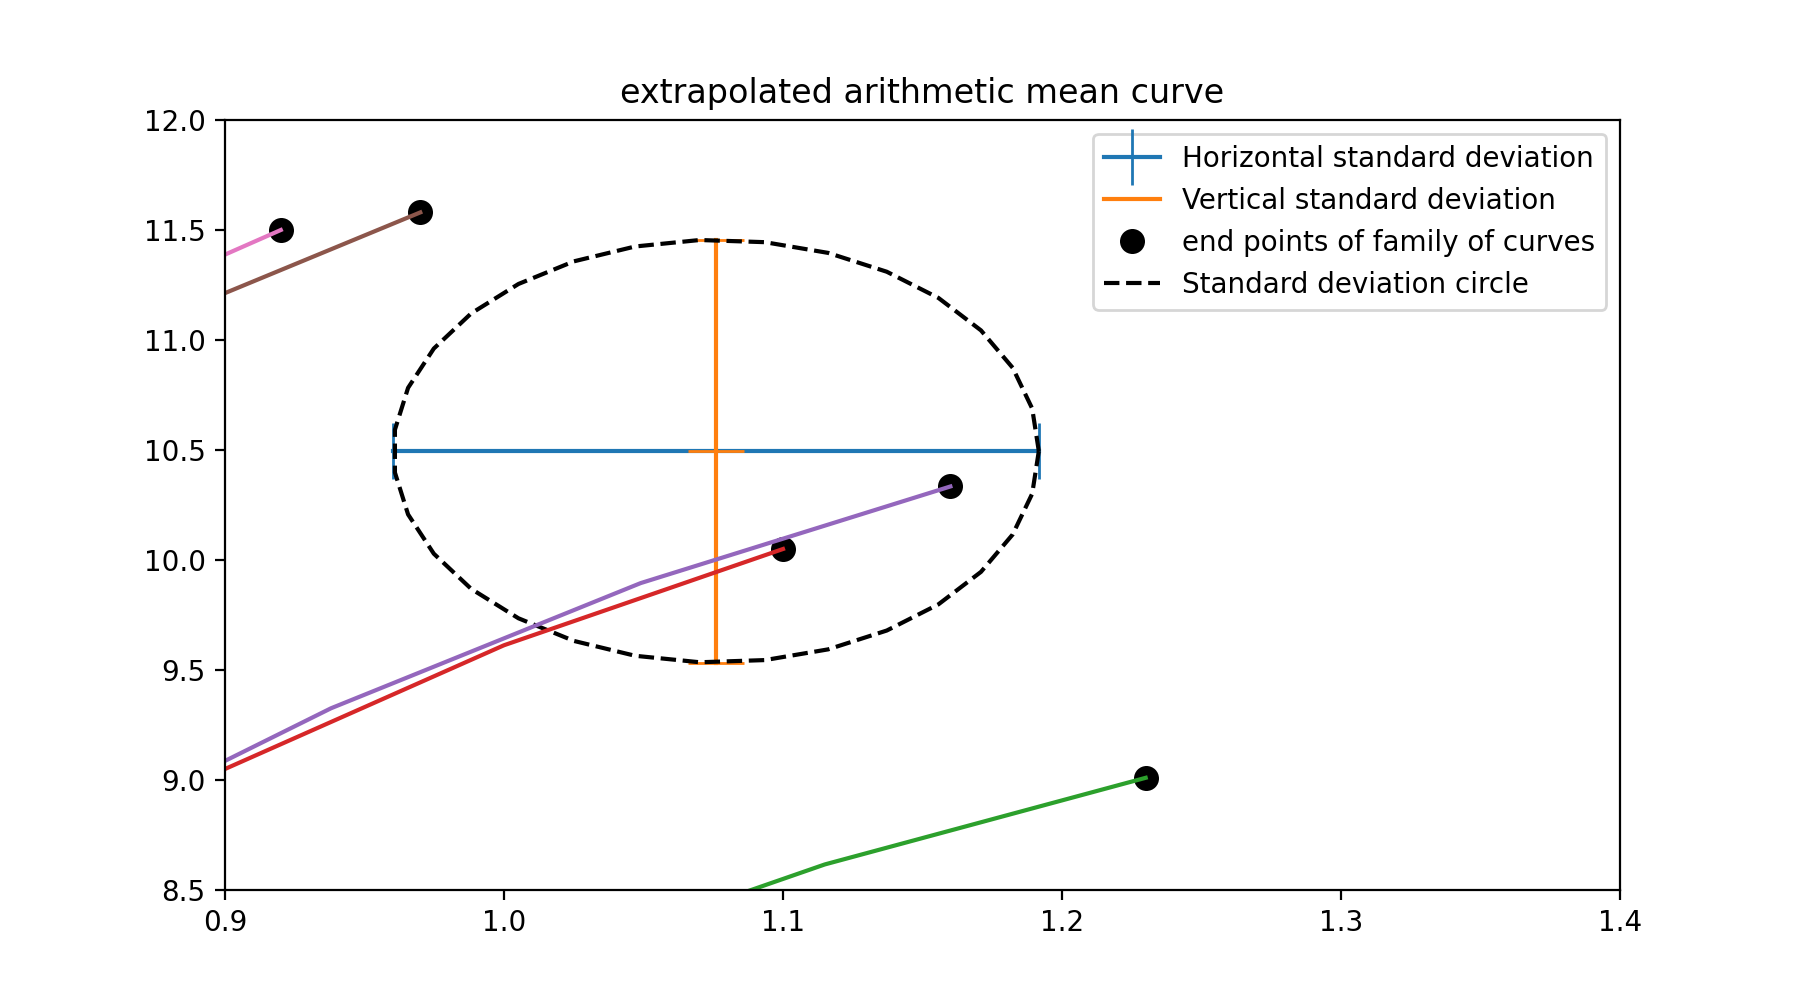
The task of the standard deviation circle is to depict the x-y relation of the family of curves end points (figure 1). Its purpose is to give a quick visual impression of the family of curves deviation, within in a plot of multiple mean curves. Plotting all family of curves in such cases might visually overburden the figure. Std circles are best used accompanied with scatter curves.
(Source code, png, hires.png, pdf)

Figure 1 Standard deviation circle.
(Source code, png, hires.png, pdf)

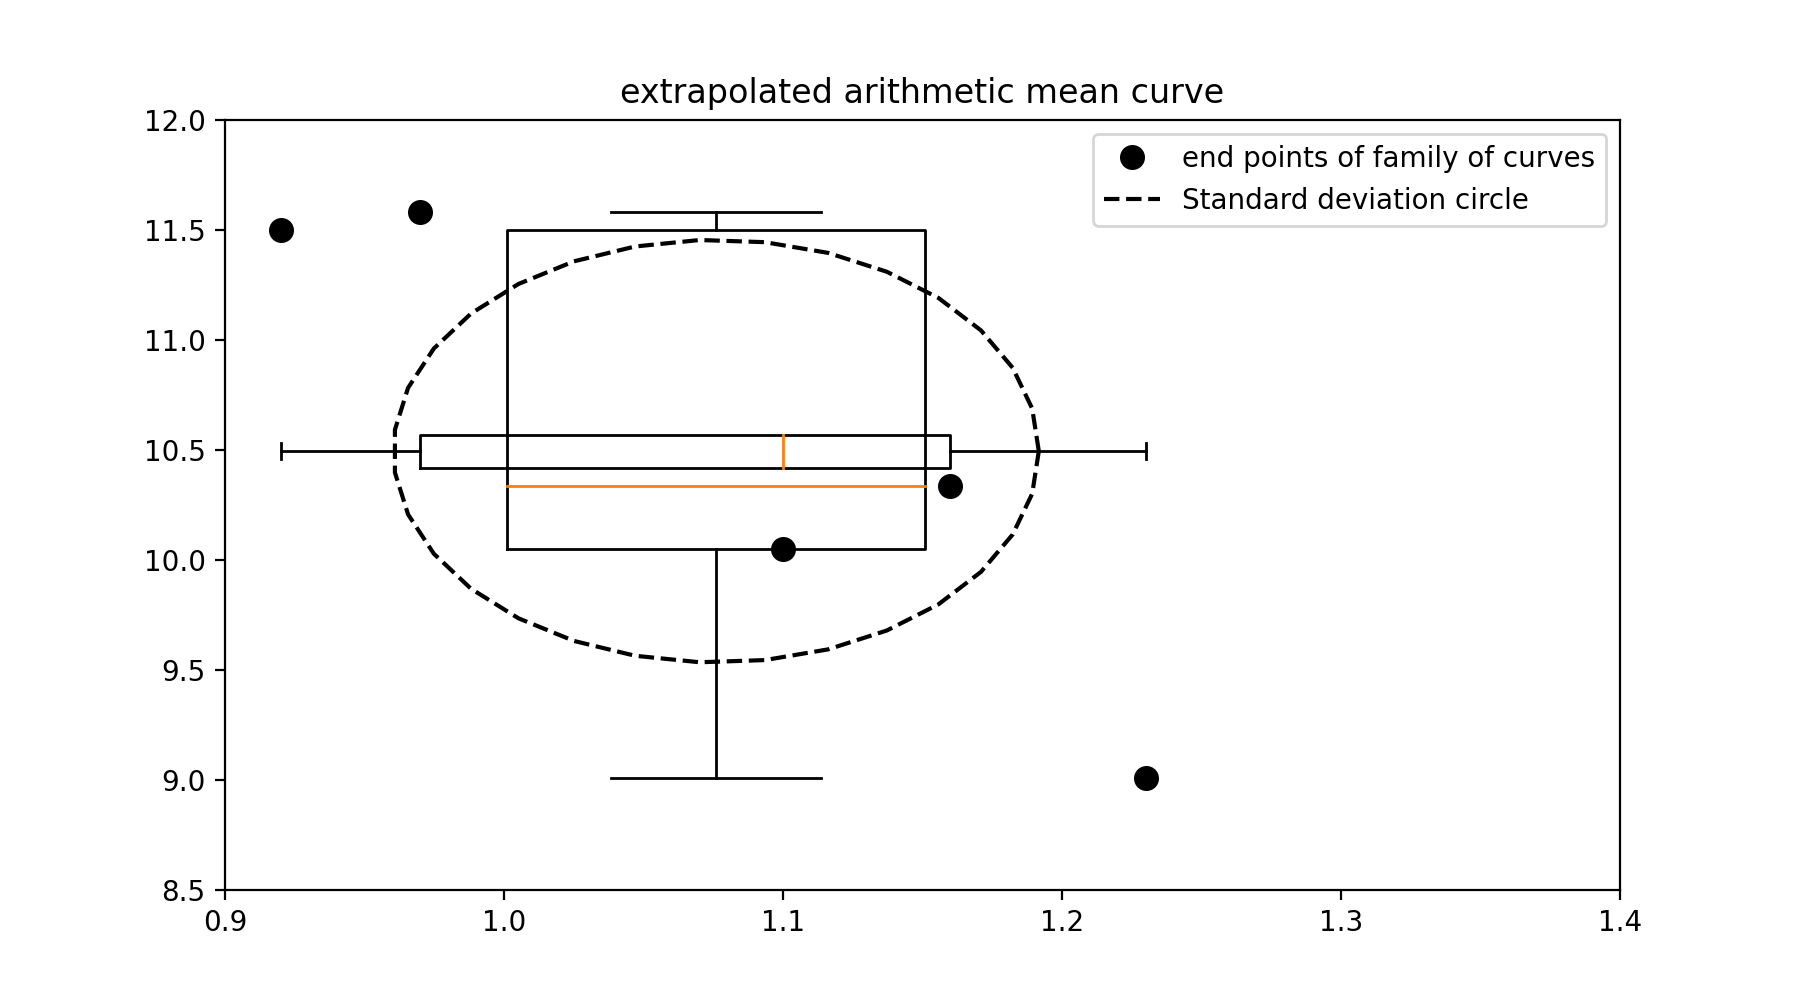
Figure 2 Standard deviation circle versus box plots.