Tests on Families of Curves
Except NonLinear0 all families of curves shown below were chosen as they triggered logical bugs within the code of prior releases.
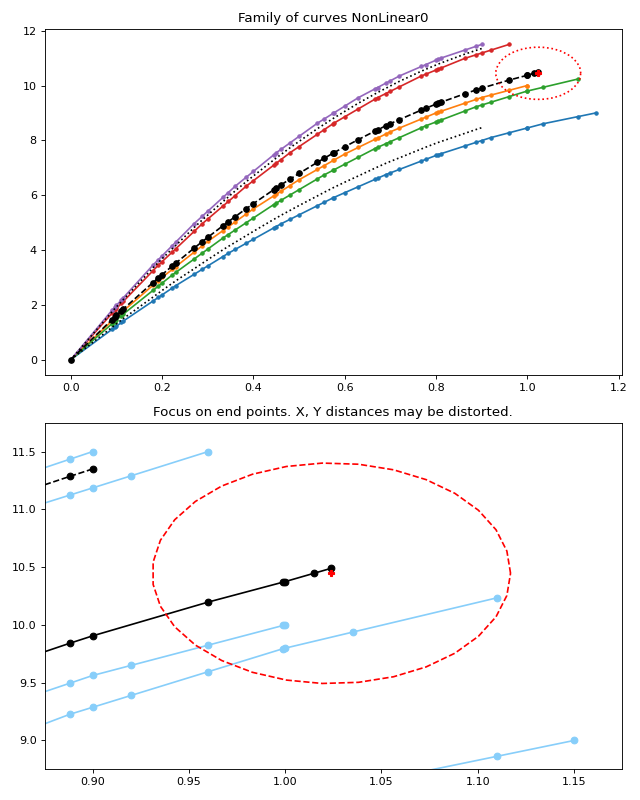
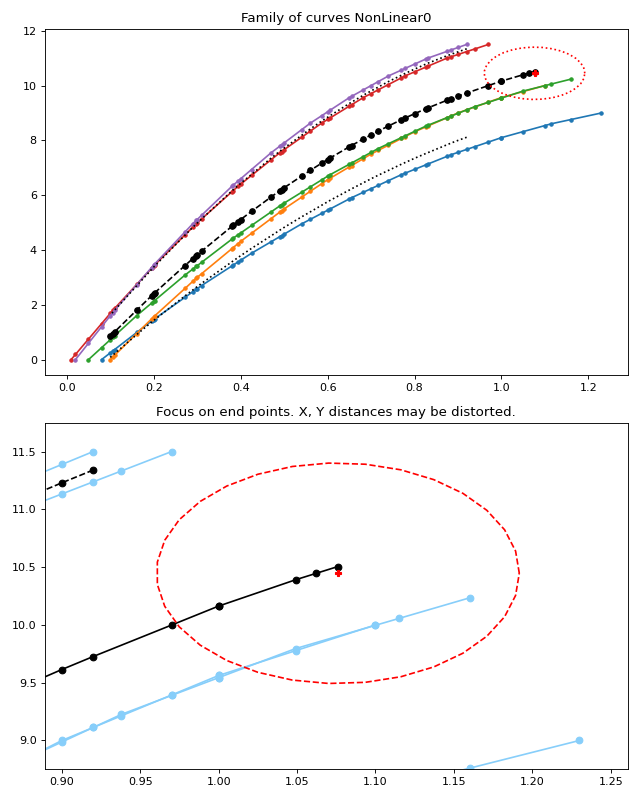
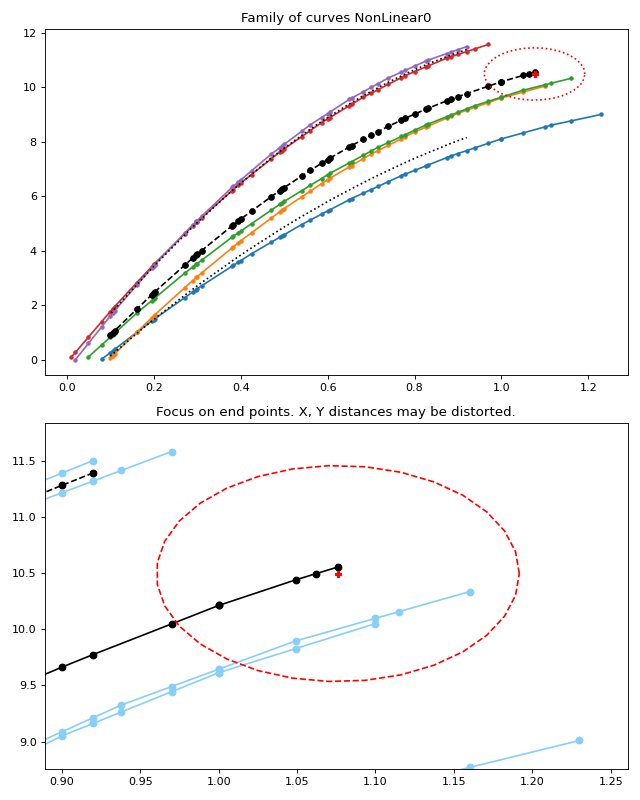
NonLinear0
This family of curve is an exemplary family of curve which was created as the first test case for the first alpha release. The curves end points are not generated using a standard deviation.
HorizontalLinear
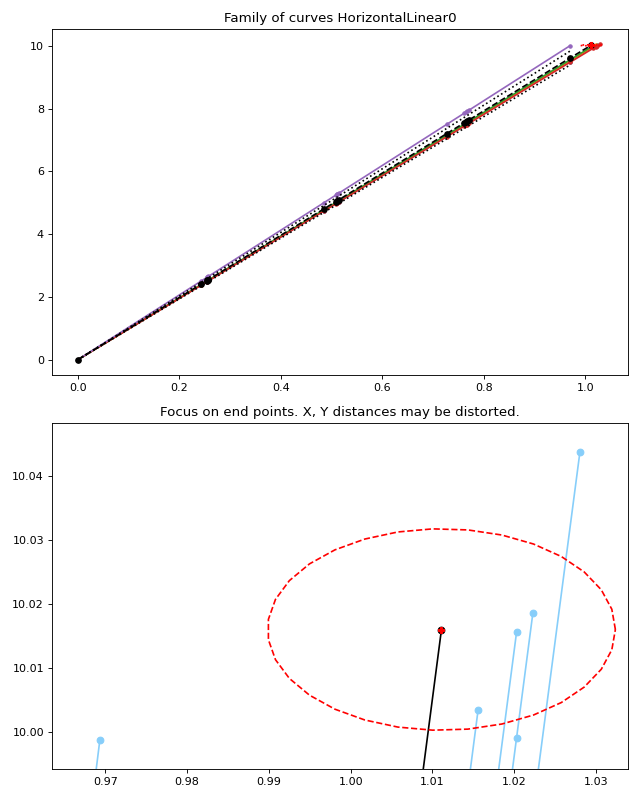
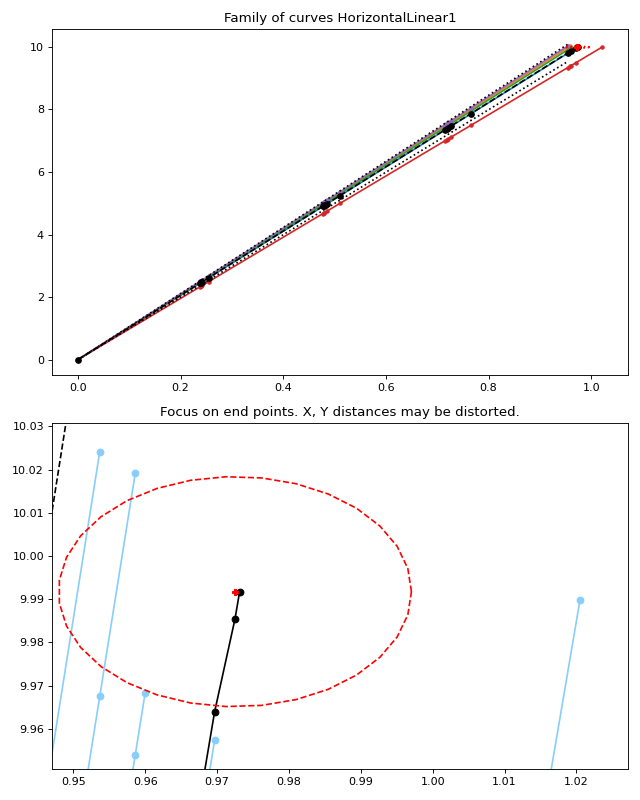
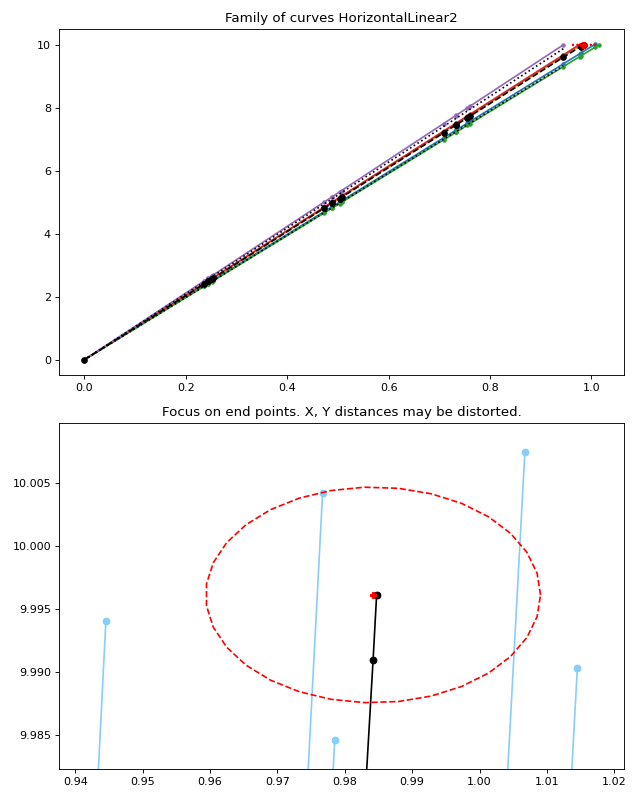
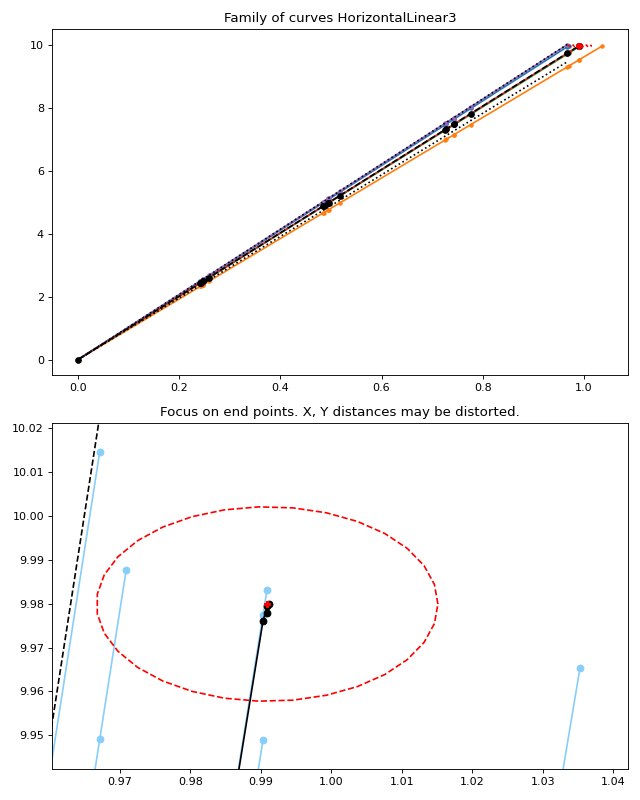
End points of all families of curves within the group of horizontal linear bases on a simple strength failure criterion. Slope (Young’s modulus) and y-values (strength) are randomly generated using a standard deviation. The x-values are calculated on basis of the generated values.
The calculation leads to horizontally aligned end points, which gives this group its name.
DiagonalLinear
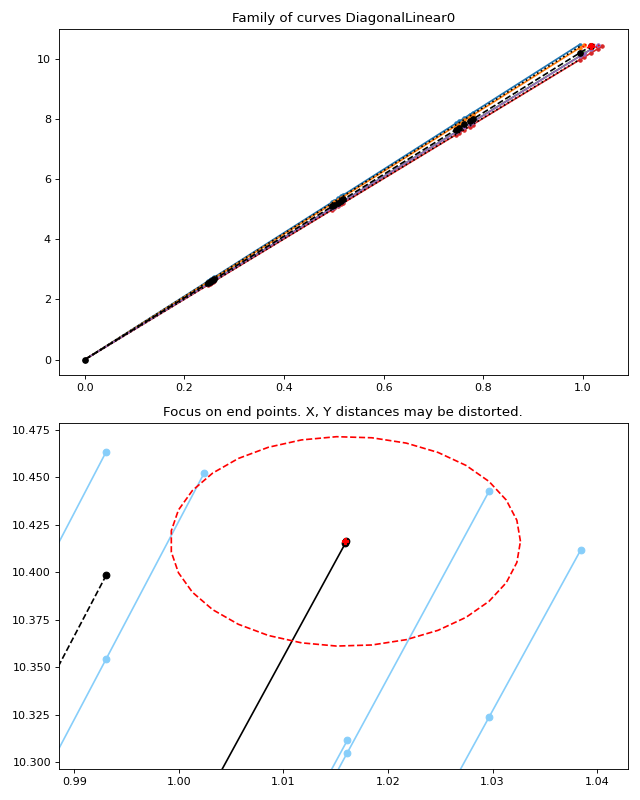
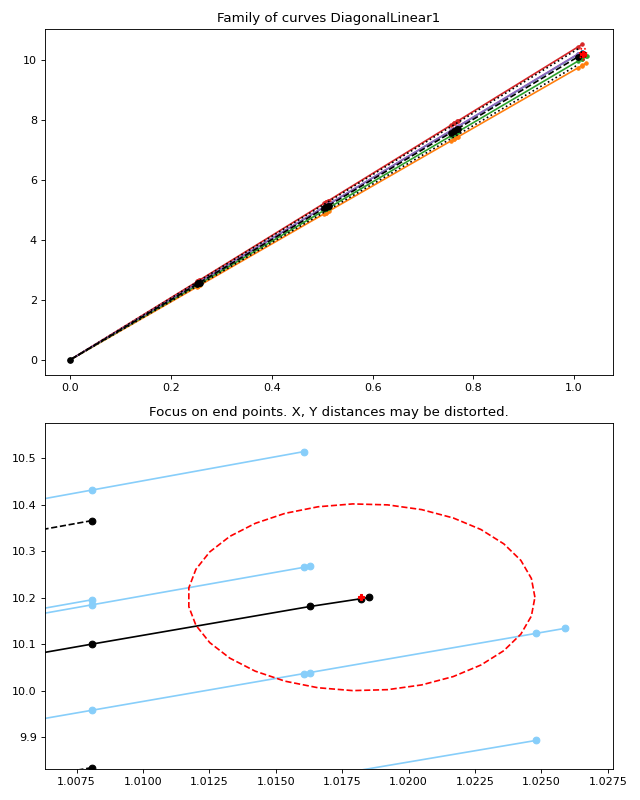
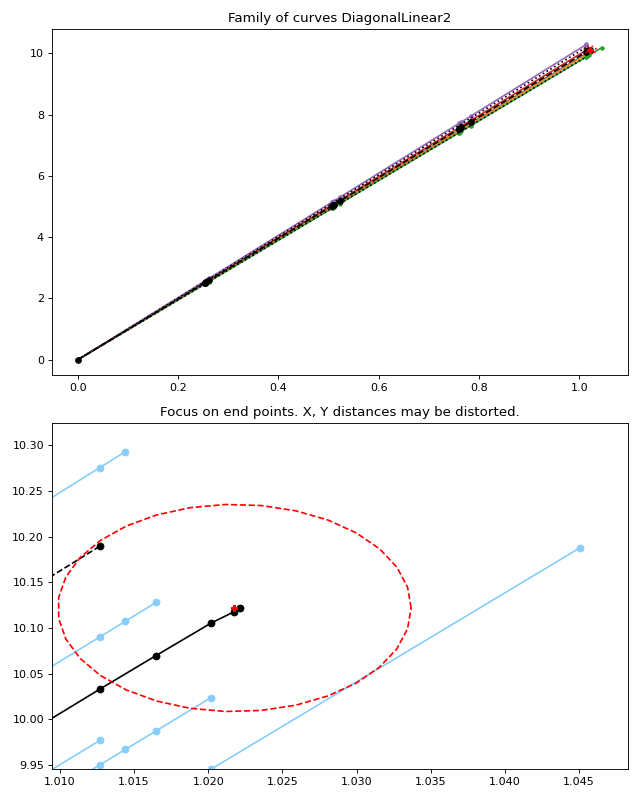
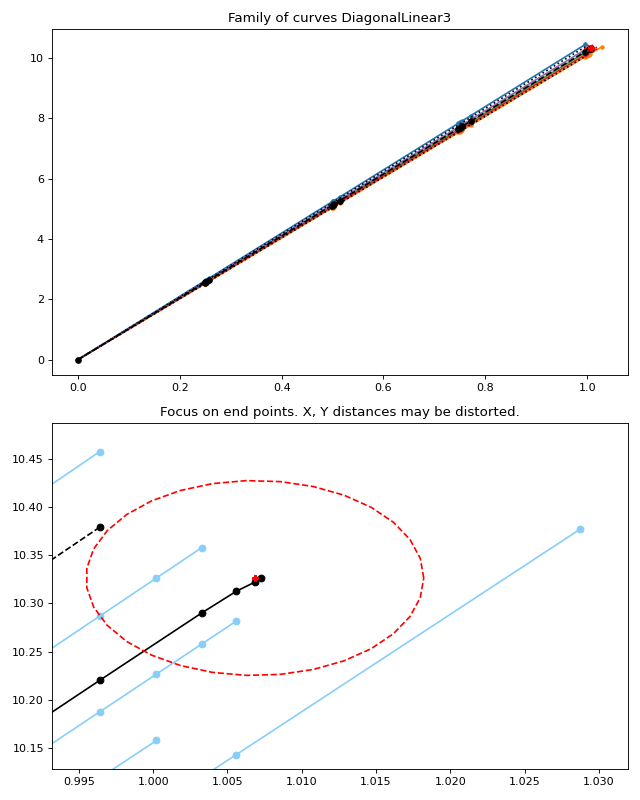
End points of all families of curves within the group of diagonal linear bases on a simple energy failure criterion. Slope (Young’s modulus) and area beneath the x-y curve (energy) are randomly generated using a standard deviation. The x-values and y-values are calculated on basis of the generated values.
The calculation leads to diagonally aligned end points, which gives this group its name.
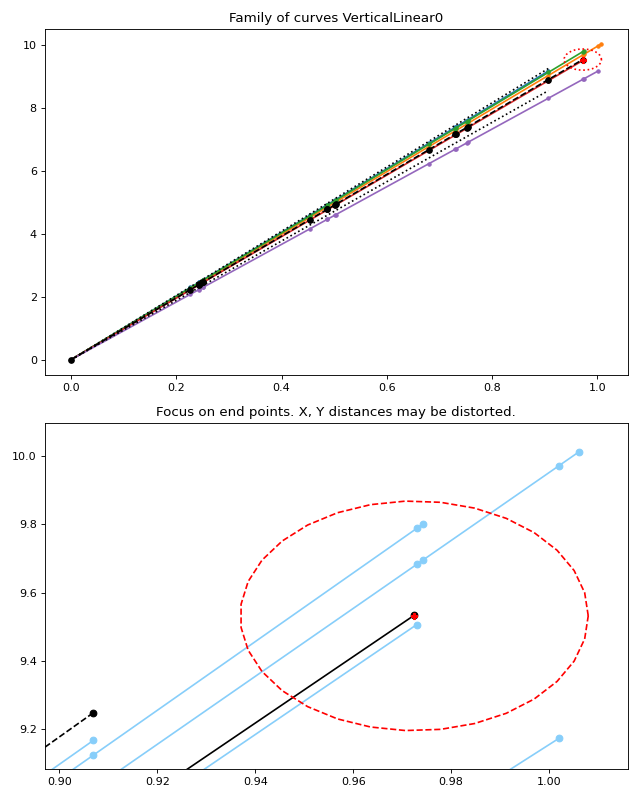
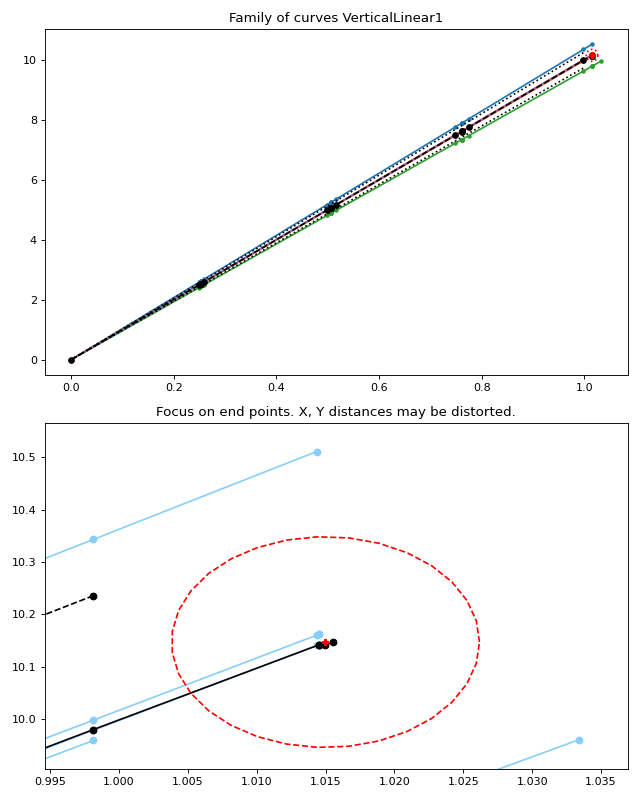
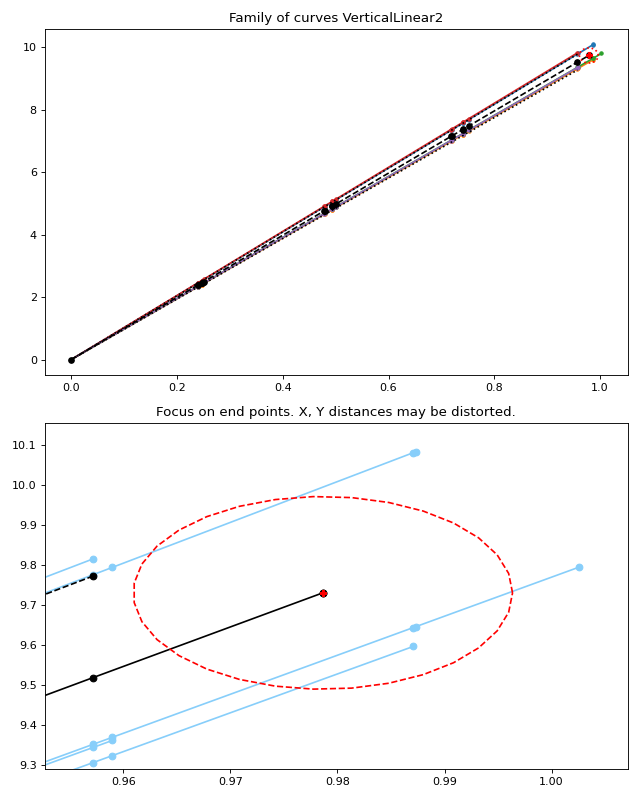
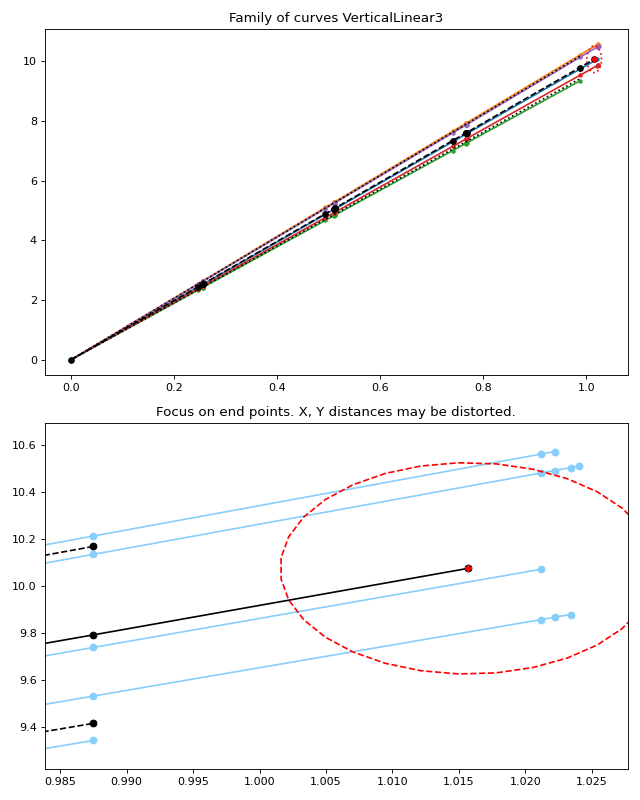
VerticalLinear
End points of all families of curves within the group of vertical linear bases on a simple strain failure criterion. Slope (Young’s modulus) and x-values (strain) are randomly generated using a standard deviation. The y-values are calculated on basis of the generated values.
The calculation leads to vertically aligned end points, which gives this group its name.
Variation 0
The arithmetic y-mean value of the ending points is located in between the last full value row and the ending part of the family of curves, which needs extrapolation.
(Source code, png, hires.png, pdf)
