family_of_curves
-
ArithmeticMeanCurve.family_of_curves¶ The curves within a DataFrame interpolated.
- Returns
DataFrame
Examples
>>> from pandas import DataFrame
>>> import numpy
>>> from arithmeticmeancurve import ArithmeticMeanCurve
>>> curve_1 = DataFrame(
...     [1, 2, 3], index=[0.1, 0.2, 0.3], columns=["y"]
... )
>>> curve_2 = DataFrame(
...     [1, 2, 3], index=[0.11, 0.19, 0.31], columns=["y"]
... )
>>> curve_3 = DataFrame(
...     [1, 2, 3], index=[0.1, 0.21, 0.30], columns=["y"]
... )
All single curves are being mapped onto a common index. Empty values are interpolated, within the curves inner boundaries.
>>> extrapolating_mean_curve = ArithmeticMeanCurve([curve_1, curve_2, curve_3])
>>> extrapolating_mean_curve.family_of_curves
      y_0       y_1       y_2
0.10  1.0       NaN  1.000000
0.11  1.1  1.000000  1.090909
0.19  1.9  2.000000  1.818182
0.20  2.0  2.083333  1.909091
0.21  2.1  2.166667  2.000000
0.30  3.0  2.916667  3.000000
0.31  NaN  3.000000       NaN
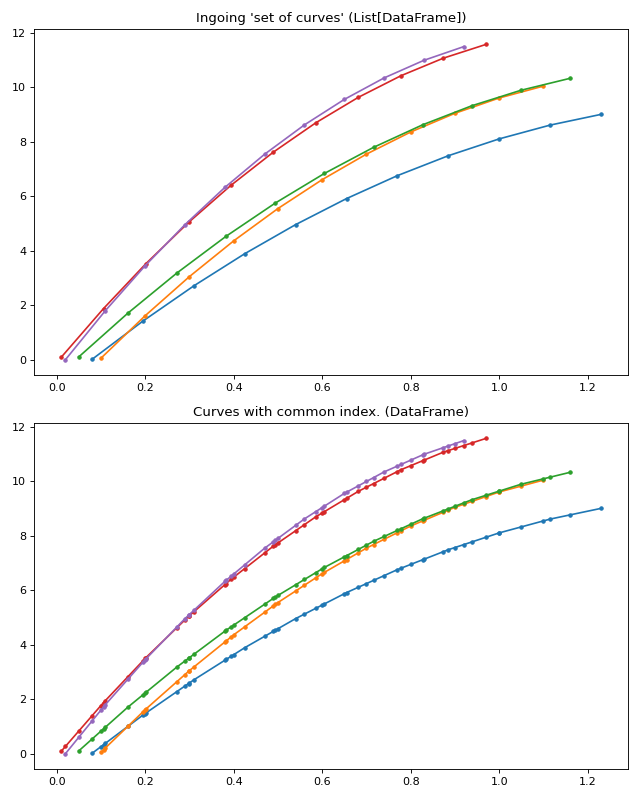
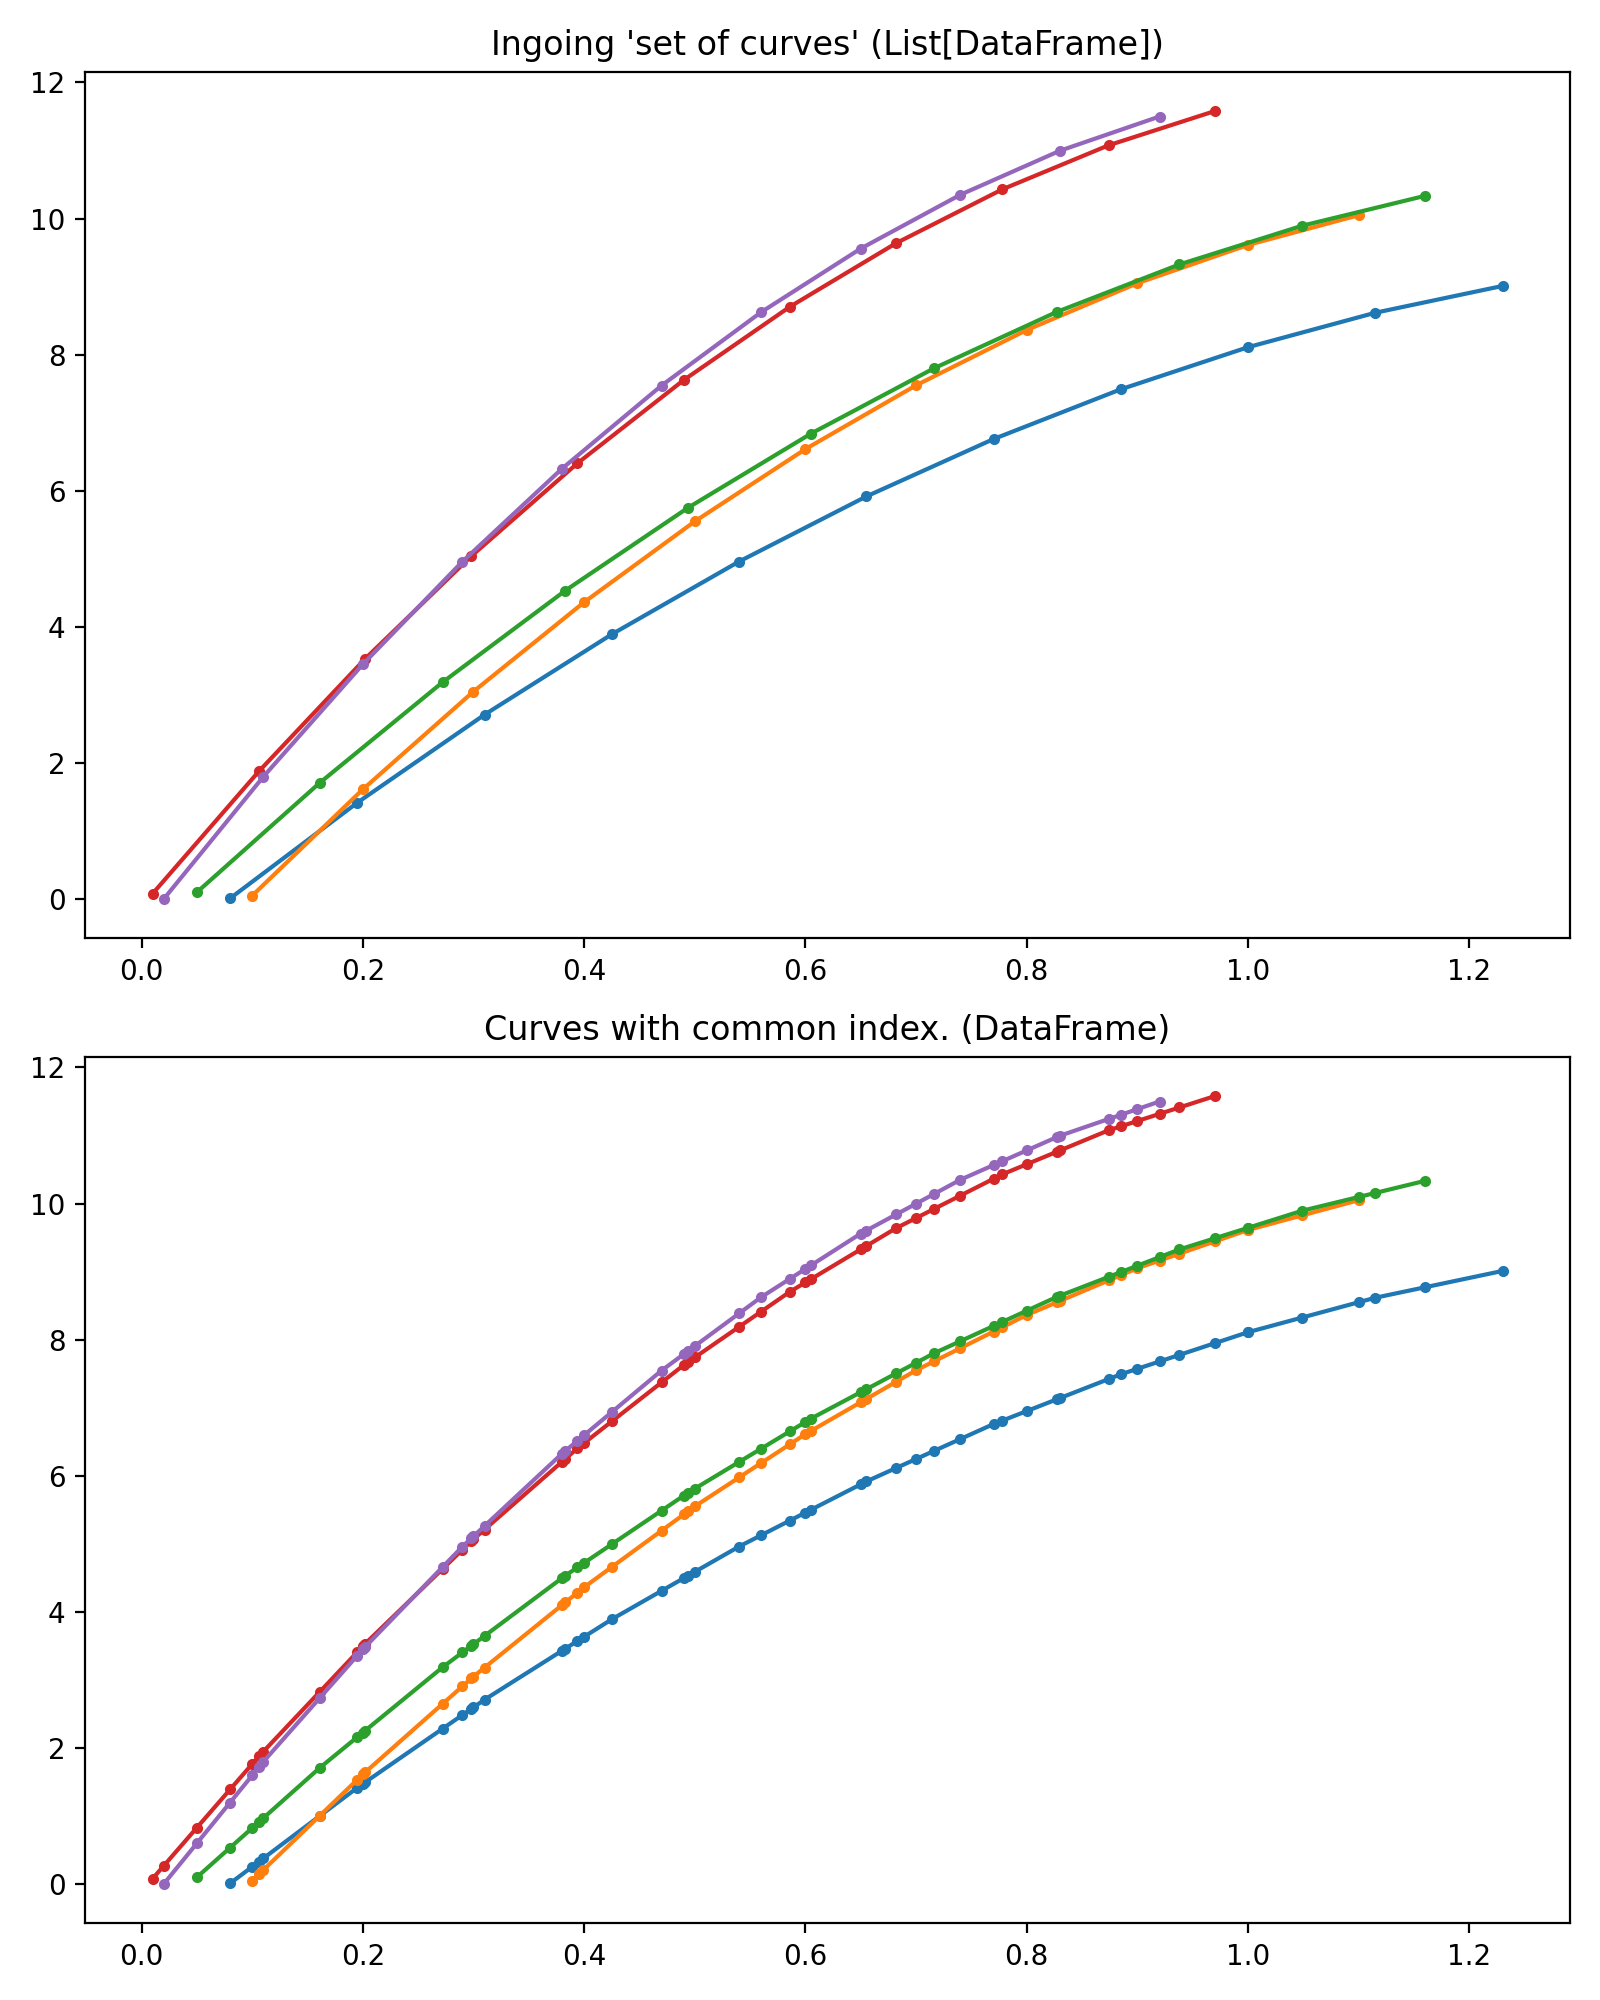
Comparision in between ‘set of curves’ and ‘family of curves’
Top figure; the ingoing ‘set of curves’ is a set of unique curves with seperated absisa values (x-values).
Bottom figure; the ‘family of curves’ share common abisa values (x-values). This is an necessary step towards the mean value curve calculation.
(Source code, png, hires.png, pdf)
